Campaign reporting insights: Visualize your campaign performance
Raw data rarely tells the whole story. In Ad Ops, far too much time is spent manually translating rows and columns into a narrative for clients or management. With our new Insights view, goTom bridges that gap. We’re giving you visual dashboards that make your most important campaign metrics instantly understandable. Move from pure data management to high-level performance analysis—with just one click.
What's new
Visualization over spreadsheets
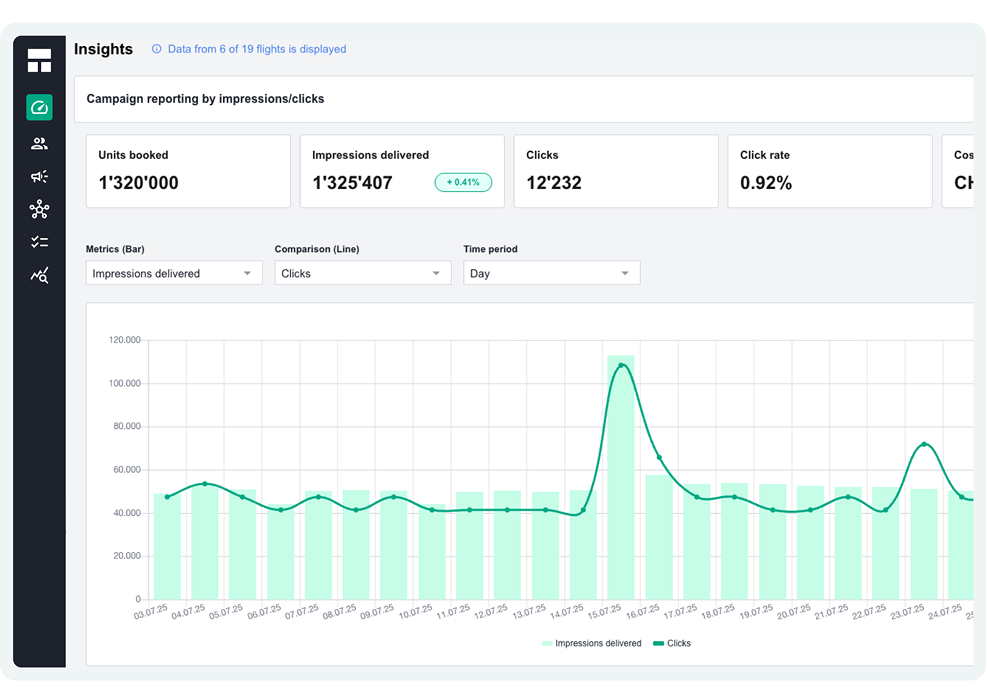
Switch instantly from the standard table to a graphical dashboard via the new “Insights” button in the top right of your reporting view. Instead of digging through columns, all metrics activated in your template are automatically transformed into clean, digestible KPIs.
The best part? goTom handles the smart KPI selection for you. Based on the specific product and client, the system highlights exactly the metrics that matter most for that case. This allows you to translate complex Ad Ops data into a professional look that your advertisers can grasp immediately, no manual prep required.
Good to know: The dashboard is entirely powered by your existing reporting templates. You decide in the Admin Center which data points should take center stage in the Insights view.
Full transparency with the delivery indicator
Our new percentage-based delivery indicator gives you instant feedback on where your campaigns stand. You can track delivery against your target values in real-time, completely eliminating the need for manual calculations. Stay flexible by analyzing progress by day, week, month, or total duration – exactly how you’ve defined it in your reporting templates. Plus, our new filtering component lets you include or exclude criteria with precision, so you can isolate the insights that truly count. In short:
- Real-time status: Current delivery levels shown in % for maximum transparency.
- Precision filtering: Isolate key data points in seconds by including or excluding specific criteria.
- Flexible timeframes: View performance data across any period defined in your template.
Reporting on the go – optimized for mobile
Professionalism today means flexibility. The Campaign Reporting view is fully responsive and optimized for tablets and smartphones. Whether you’re presenting performance directly on a tablet during a client lunch or doing a quick status check while on the move, your data is always at your fingertips.